The totals, 23 May 2022 to end of September 2026
| Measure | Total | Source |
|---|---|---|
| Voucher applications | 160,874 | Ofgem; DESNZ |
| Vouchers issued (DESNZ count) | 131,619 | DESNZ |
| Vouchers issued (Ofgem count) | 101,029, worth £721,534,000 | Ofgem |
| Redemption applications | 98,735 | DESNZ |
| Redemptions paid | 96,611 | Ofgem |
| Value of grants paid | £661,303,000 | Ofgem |
| Share of redemptions that were air source | 98% | DESNZ |
| Share that were domestic properties | 99.4% | DESNZ |
The gap between applications and grants paid is mostly timing and attrition: installations still in progress, vouchers that expire unused, and applications withdrawn or rejected. The two sources count issued vouchers differently, so we show both rather than pick one. Treat the rows as a map of the stages, not as a conversion rate.
Applications in 2026
| Month | Applications |
|---|---|
| Jan | 3,264 |
| Feb | 3,632 |
| Mar | 4,517 |
| Apr | 4,406 |
| May | 4,411 |
| Jun | 4,512 |
| Jul | 8,150 |
| Aug | 7,486 |
| Sep | 9,738 |
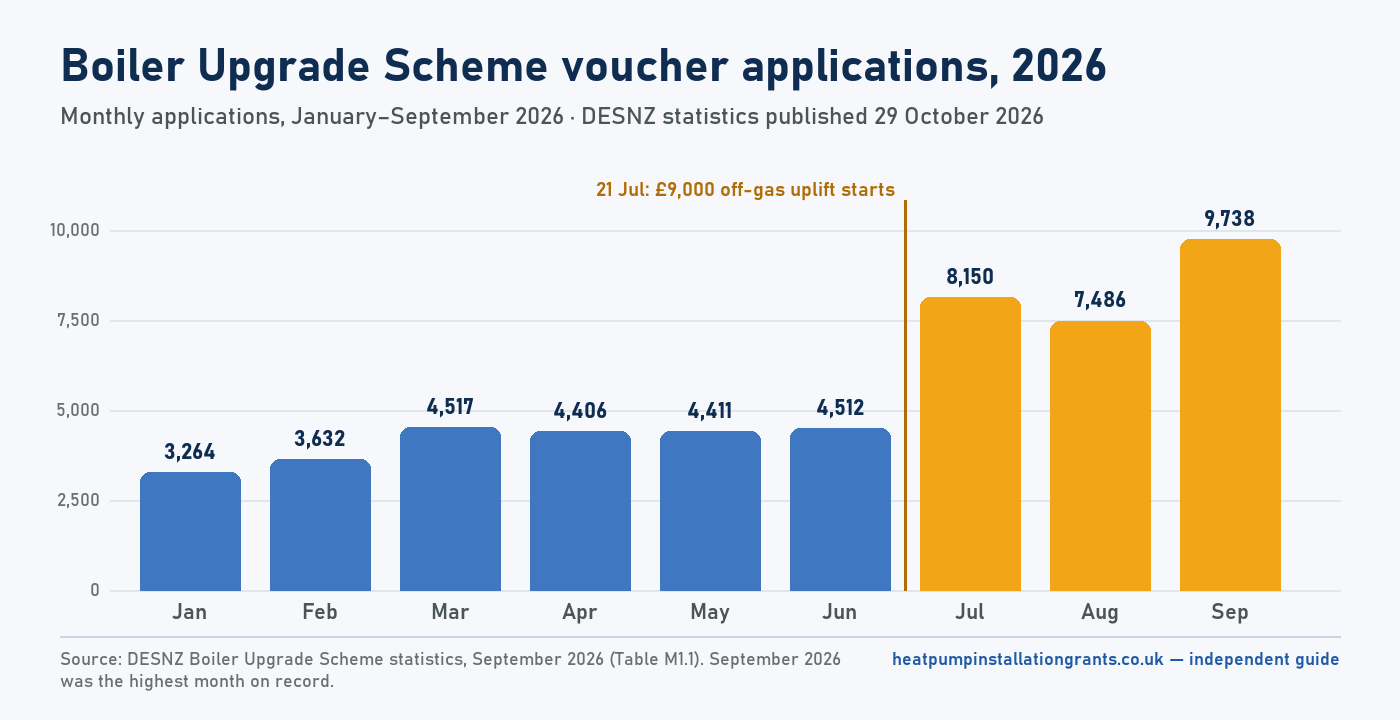
Applications roughly doubled after June. September 2026 set a new record at 9,738, 30% more than August and 138% more than September 2025 (DESNZ commentary). Before that, July set a record at 8,150, and August’s 7,486 was 120% higher than August 2025 (3,401). August also set records for vouchers issued (5,903) and redemptions (3,260).
How long the money is set to last, and the scheme closing date, are on the scheme end date and budget page.
The off-gas band and demand
The £9,000 grant for off-gas oil and LPG homes began on 21 July 2026. From July to September, 8,107 applications were for the higher amount, which is 32% of the 25,374 applications in those three months. The timing lines up with the jump in demand, but the statistics alone cannot show how much of the rise the band caused. The band applies to applications made up to 31 March 2027; the rules are on the £9,000 grant page.
The two ends of the regional range have their own pages: London, with the lowest take-up per household, and the South West, with the highest.
Installation costs
DESNZ reports the median installed cost of grant-funded systems, including the grant value. In 2026 Q3 it was £12,826 for an air source heat pump and £34,630 for ground source. The air source median was £12,860 in 2022 Q3 (£14,989 in 2026 prices), so the 2026 figure is 14% lower in real terms (DESNZ notes that the mix of system sizes affects the trend) and £34 lower in cash terms. After the £7,500 grant, the median air source job leaves about £5,326 to pay, and the median ground source job about £27,130. The ground source median moves a lot between quarters because few systems are installed and their sizes vary: it was £27,232 in 2026 Q2 at a median 10.5 kW, and £34,630 in 2026 Q3 at 15 kW. The air source cost guide and ground source cost guide work through why individual jobs differ.
What heat pumps replaced
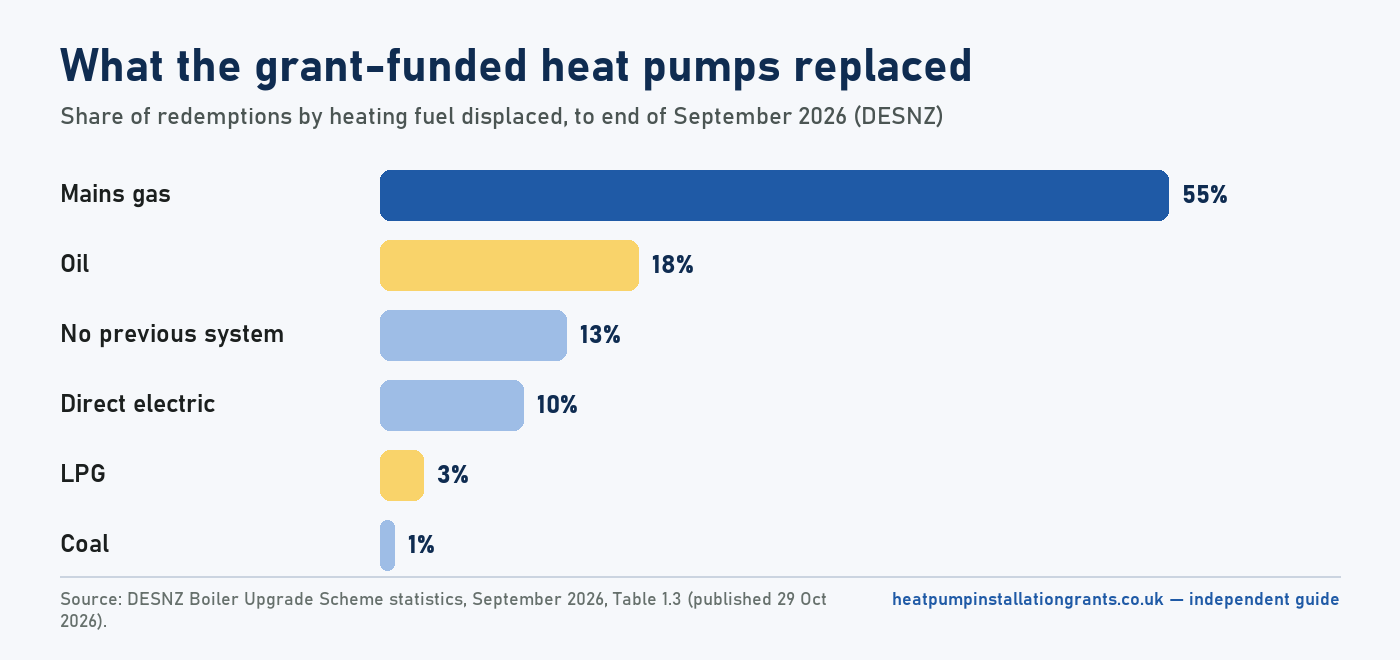
More than half of paid grants, 55%, replaced mains gas. Oil accounted for 18%, direct electric 10%, LPG 3% and coal 1%; 13% are recorded as replacing no previous system. 61% of properties were on the gas grid. Ground source is the rural, off-gas technology: 82% of ground source redemptions were off-gas and 84% rural. Biomass is rare at 421 redemptions in total.
Where grants go
| Region | Grants paid | Share |
|---|---|---|
| South East | 19,069 | 20% |
| South West | 17,168 | 18% |
| Wales | 5,148 | 5% |
| North East | 3,033 | 3% |
The South East and South West lead and the North East has the fewest of all regions (DESNZ commentary). Urban and rural properties are close to an even split (51% urban, 49% rural). The scheme rules are the same everywhere in England and Wales; Scotland and Northern Ireland are covered separately on heat pump grants by country.
How to read the figures
Four terms trip people up. A voucher application is made by the installer when a job is agreed. A voucher issued means Ofgem has approved it and the validity clock has started. A redemption application is the installer claiming the grant after commissioning, and a redemption paid is the grant actually paid out. Each stage lags the one before by weeks or months, so a jump in applications in July shows up in redemptions later.
The cost figures are medians of reported installation costs including the grant value, published by quarter, and they describe grant-funded jobs only. The shares by fuel, region and property type are cumulative across the life of the scheme, so a 2026 change such as the off-gas band moves them only slowly. The process behind each stage is on how to apply.
Next release
DESNZ publishes monthly; the next release is due on 26 November 2026. Ofgem’s monthly scheme update gives running totals and the remaining budget for the year, £199,563,000 on 9 September 2026, a figure that Ofgem says still includes undecided applications and vouchers issued but not yet redeemed. We update this page when new figures come out. For what the numbers mean for your own home, start with eligibility.
Reading the numbers
“Record applications mean the money will run out.”
Demand has risen, but Ofgem reported £199,563,000 of the year’s budget remaining on 9 September 2026, and describes the figure as dynamic because vouchers expire or are returned. See end date and budget.
The budget is first come, first served. If July-level demand continued all year the balance would come under pressure, which is why each monthly release is worth reading.
“These are national averages, so they say nothing about my house.”
They describe grant-funded jobs across England and Wales. For your own home, the useful numbers are a survey and written quote; the medians only tell you whether a quote is in a plausible range.
Medians hide a wide spread between a terrace and a large detached house or a ground source install.